TV has been a reliable way to build brand awareness and drive sales, but OTT apps are changing the game. These platforms let people stream content online without relying on cable boxes, combining the massive reach of traditional TV with the convenience and control of the internet. For brands, content creators, and distributors, OTT is quickly becoming a must-have strategy.
The best part? OTT apps let you connect with audiences that regular TV often misses. With 75% of Americans using multiple platforms and many choosing ad-supported plans, it’s the perfect opportunity to engage viewers while they’re enjoying their favorite shows.
This post is packed with insights to help you dominate the OTT space. Let’s dive in.
The OTT industry market size in the United States
The OTT market in the United States is valued at $341.4 billion in 2025 and is projected to reach $386 billion by 2027. The market is projected to grow at an average annual rate of 6.30% and reach $429.4 billion by 2029.
The United States’ OTT market is the largest in the world, with around 377 independent providers and 4 in 10 people naming streaming as their primary way to watch TV. The widespread adoption of smart devices, the increasing demand for video-on-demand content, and a high per-user payment rate are significant contributors to the OTT market’s growth.
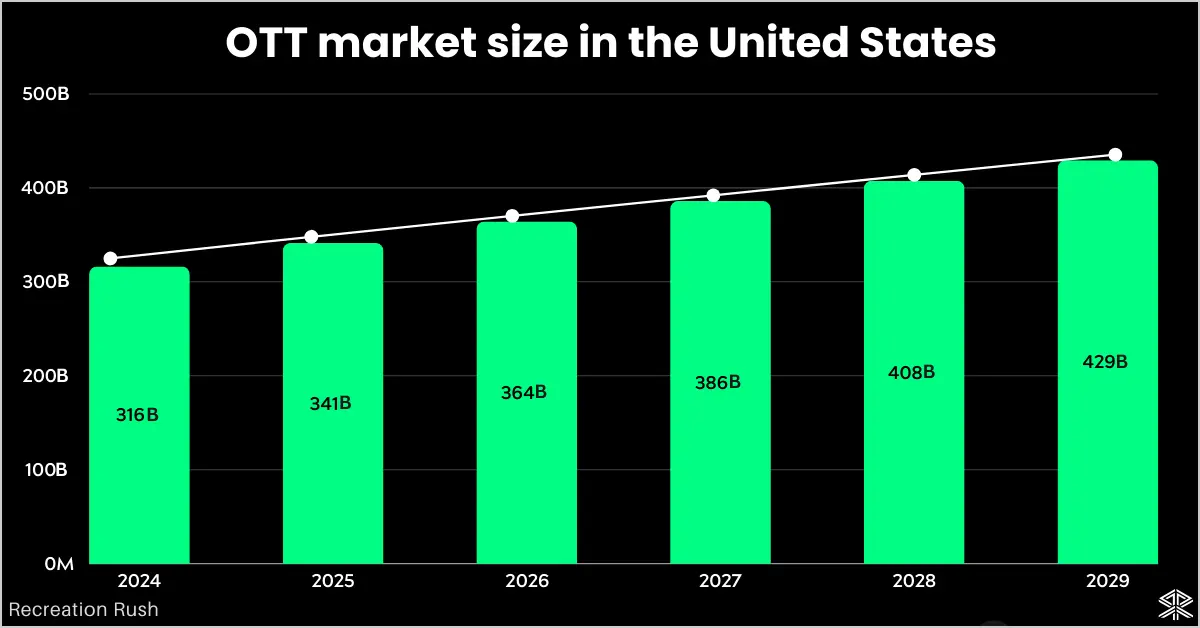
Here is a table showing the United States’ OTT market size from 2024 to 2029:
| Year | OTT market size |
|---|---|
| 2024 | $316.4 billion |
| 2025 | $341.4 billion |
| 2026 | $364.3 billion |
| 2027* | $386 billion |
| 2028* | $407.7 billion |
| 2029* | $429.4 billion |
Source: Statista.
OTT market size in the United States by segment
As of 2026, the OTT video advertising market has the biggest share in the total OTT industry, with a market volume of $207.50 billion. The video streaming (SVoD) sector has the second-largest share with a market volume of $108.5 billion.
Pay-per-view and video downloads segments collectively account for 5.35% of the total OTT market size.
Source: Statista.
Number of OTT users worldwide
The Number of OTT users has risen by 5.6% from the previous year to reach 4.13 billion in 2026, which is equivalent to 50.36% of the world’s population. This count is estimated to rise by 25.46% in the next 4 years and reach 4.92 billion by 2029.
Here is a table showing global OTT user count from 2024 to 2029:
| Year | Global OTT users |
|---|---|
| 2024 | 3.92 billion |
| 2025 | 4.13 billion |
| 2026 | 4.33 billion |
| 2027* | 4.53 billion |
| 2028* | 4.72 billion |
| 2029* | 4.92 billion |
Source: Statista.
Number of OTT users in the United States
There are 246.5 million OTT users in the United States alone, equivalent to 71% of the country’s population and 6% of the global OTT user base. It is estimated that the OTT user penetration in the country will increase to 72.4% by the end of 2026, taking the user count to 250 million.
| Year | OTT Users in the United States |
|---|---|
| 2022 | 236.39 million |
| 2023 | 239.21 million |
| 2024 | 242.82 million |
| 2025 | 246.5 million |
| 2026 | 249.99 million |
| 2027* | 253.25 million |
| 2028* | 256.52 million |
| 2029* | 259.78 million |
Being the world’s biggest OTT market and home to 377 independent OTT providers, the US market is home to 6% of the world’s OTT users, with 3/4th of them having more than 2 active subscriptions.
Source: Statista.
75% of American OTT users are subscribed to more than two platforms
The number of OTT subscriptions has surpassed the US population, as 3 out of 4 Americans are subscribed to two or more OTT platforms. Currently, there are 411 million OTT subscriptions in the country.
People have embraced OTT platforms ever since the COVID-19 pandemic started; fewer people in the United States are paying for traditional TV, dropping from over 80% in 2015 to less than 60% now.
The US OTT market is highly competitive, and it’s only rising with newer streaming services like Peacock and HBO Max coming in.
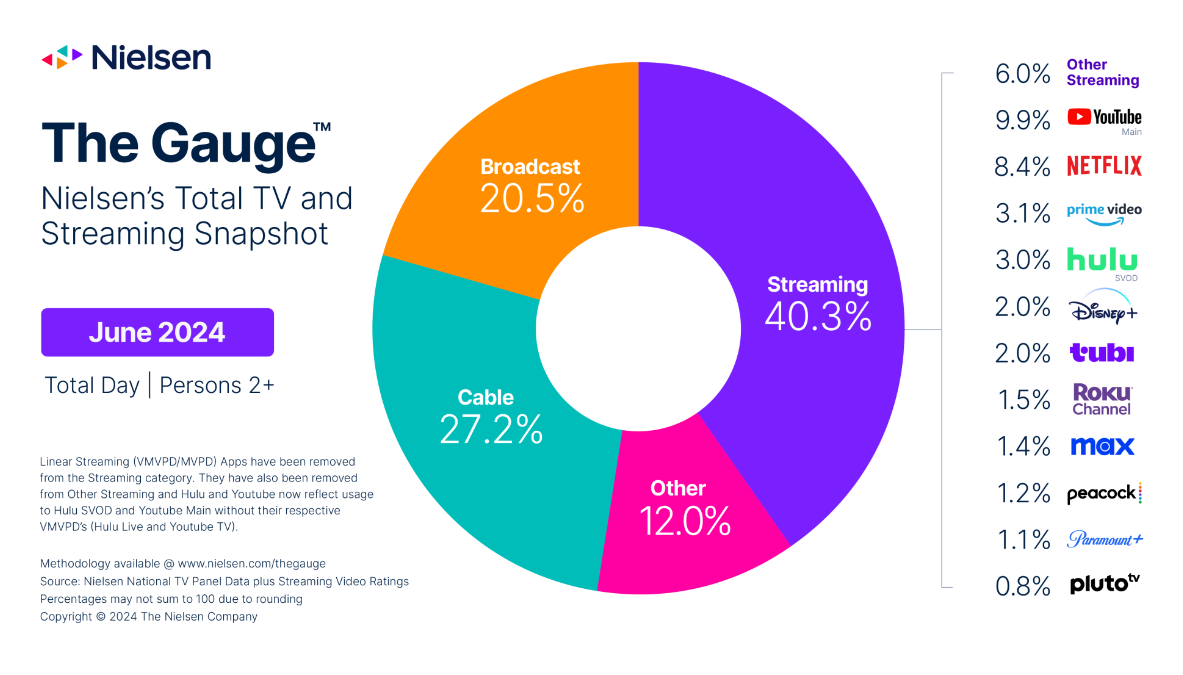
44.8% of American internet users say streaming is their main way of watching TV
Streaming took a solid 44.8% share in total TV usage in the United States as of 2026, whereas cable accounted for 24.1% of the share. Streaming’s share of total television usage outpaced the combined share of broadcast and cable for the first time ever.
Between May 2021 and 2026, streaming has clearly taken over as the top way people watch TV, with usage jumping by 71%. In contrast, traditional formats have slipped, with cable viewership down 39% and broadcast TV down 21%. Still, despite the decline, traditional TV continues to hold its ground more than expected.
Netflix has remained the top subscription-based streaming service for four years in a row, with its viewership increasing by 27% since May 2021. But it’s not just paid platforms driving the growth. Free services have played a major role as well. YouTube (excluding YouTube TV) has seen consistent growth of over 120% since 2021. In May alone, it accounted for 12.5% of all TV viewing. This was its fourth consecutive monthly increase and the highest share ever recorded for any streaming platform.
FAST platforms such as Pluto TV, The Roku Channel, and Tubi are also gaining popularity. Combined, they made up 5.7% of total TV usage in May, which is more than any individual broadcast network during the same period. Another key factor behind the rise of streaming is the shift by traditional media companies toward streaming-first strategies. Platforms like Hulu, Paramount+, and Peacock have expanded their availability to better connect with digital-first audiences. Instead of replacing linear TV, they now complement it.
SVOD market share in the United States
In the fourth quarter of 2024, Amazon Prime Video and Netflix were the top streaming services in the US, each with 22% of the market share. Max came next with a 14% market share.
| Streaming platform | US market share |
|---|---|
| Amazon Prime Video | 22% |
| Netflix | 22% |
| Max | 14% |
| Disney+ | 11% |
| Hulu | 10% |
| Paramount+ | 9% |
| Apple TV+ | 9% |
| Others | 3% |
Source: Statista.
OTT users prefer cheap ad-supported plans
The increasing availability of affordable ad-supported tiers is offering relief to SVOD subscribers. Currently, 46% of households include at least one ad-supported tier in their paid service lineup. 57% of people will always choose an ad-supported plan if they decide to subscribe.
This highlights the need to diversify monetization models to accommodate different consumer preferences and affordability levels.
8 out of 10 Amazon Prime Video subscribers have chosen its ad-supported plan, while this number is merely 7.5% for Netflix.
Here is a table showing ad-supported subscriptions as a share of total subscriptions by service
| Amazon Prime Video | 80% |
| Peacock | 77.7% |
| Paramount+ | 73.2% |
| Hulu | 68.1% |
| Disney+ | 25% |
| MAX | 20.8% |
| Netflix | 7.5% |
Source: Global logic.
Content recommendations drive the viewership on OTTs
Subscribers stick around when there’s interesting content that’s easy to find. An OTT app’s success mainly depends on how easy it is to discover content. For example, recommendations drive 80% of shows watched on Netflix and 70% of YouTube views.
Recommendations are so important that 51% of people say “accessibility or search of desired content” ranks in their top three reasons for choosing an OTT app or streaming service.
Did you know Netflix saves over $1 billion every year just by recommending the most relevant content to each user? Well, now you do!
Source: Magnet Global
56% of marketers globally plan to increase their spending on OTT platforms
56% of marketers globally report planning to increase their spending on OTTs in 2026, representing a slight increase from 53% in 2024. If we exclusively talk about North American marketers, 66% plan to increase their budget for advertising on OTTs.
Source: Nielsen.
45% have canceled a streaming subscription within the last year
Customer defections across premium streaming services increased to 6.3% from 5.1% a year earlier. 45% of Americans canceled their SVOD subscriptions within the last year, with 26% citing the platform’s cost as their decision.
Here is a table showing the leading reasons among Americans to cancel their SVOD subscriptions:
| Reason to cancel SVOD subscription | Share of respondents |
|---|---|
| Increasing Cost | 26% |
| Better content elsewhere | 13% |
| Lost interest in content | 10% |
| Not enough time to watch content | 9% |
| Used the service to watch specific content then stopped | 6% |
| Platform confusing or difficult to navigate | 4% |
Statistics on top OTT platforms
Let us look at the statistics of the top OTT players in the United States.
1. Netflix Stats
- Netflix has 301.6 million subscribers globally with 84.80 million users in the US and Canadian region.
- Netflix has 3,600 movies and 1,800 TV shows in its US library.
- Netflix spent 12 billion on its content production in 2023.
- In Q4 2025, Netflix reported revenue of $10.55 billion, which is a 13% YoY increase.
- US adults spend an average of 1 hour and 2 minutes per day watching Netflix.
- Netflix has around 13,000 full-time employees worldwide, out of which 9,000 are based in the US and Canada.
2. Amazon Prime Video
- There are over 180 million Amazon Prime Video viewers in the United States.
- Amazon Prime Video is expected to have 250 million global subscribers by 2027.
- Prime Video holds 22% of the OTT market share in the United States.
- 11% of consumers stated that Prime Video is the main reason they subscribe to the Amazon Prime service.
- Among Amazon Prime Video subscribers aged 35 to 54, 96% use their subscription to watch TV shows and movies. People aged 18 to 34 do so 89% of the time.
3. Disney+
- Disney Plus has 124.6 million subscribers worldwide as of Q4 2025.
- The average revenue per user for Disney+ is $7.55.
- Disney+ generated $10.4 billion in revenue during the fiscal year 2024.
- Disney Plus holds an 11% share in the United States OTT market.
- A quarter of Disney Plus subscribers are 25 to 34 years old.
4. Hulu
- Hulu has 53.6 million subscribers as of Q4 2025.
- Hulu users spend an average of 53 minutes per day watching content.
- Hulu holds a 10% share of the United States OTT market.
- 55% of Hulu subscribers have an ad-supported plan, while the remaining 45% of users have an ad-free plan.
- Hulu’s average monthly revenue per paying subscriber in the United States is $12.52.